Case study · Power BI · 2026
Which stock is about to become a loss?
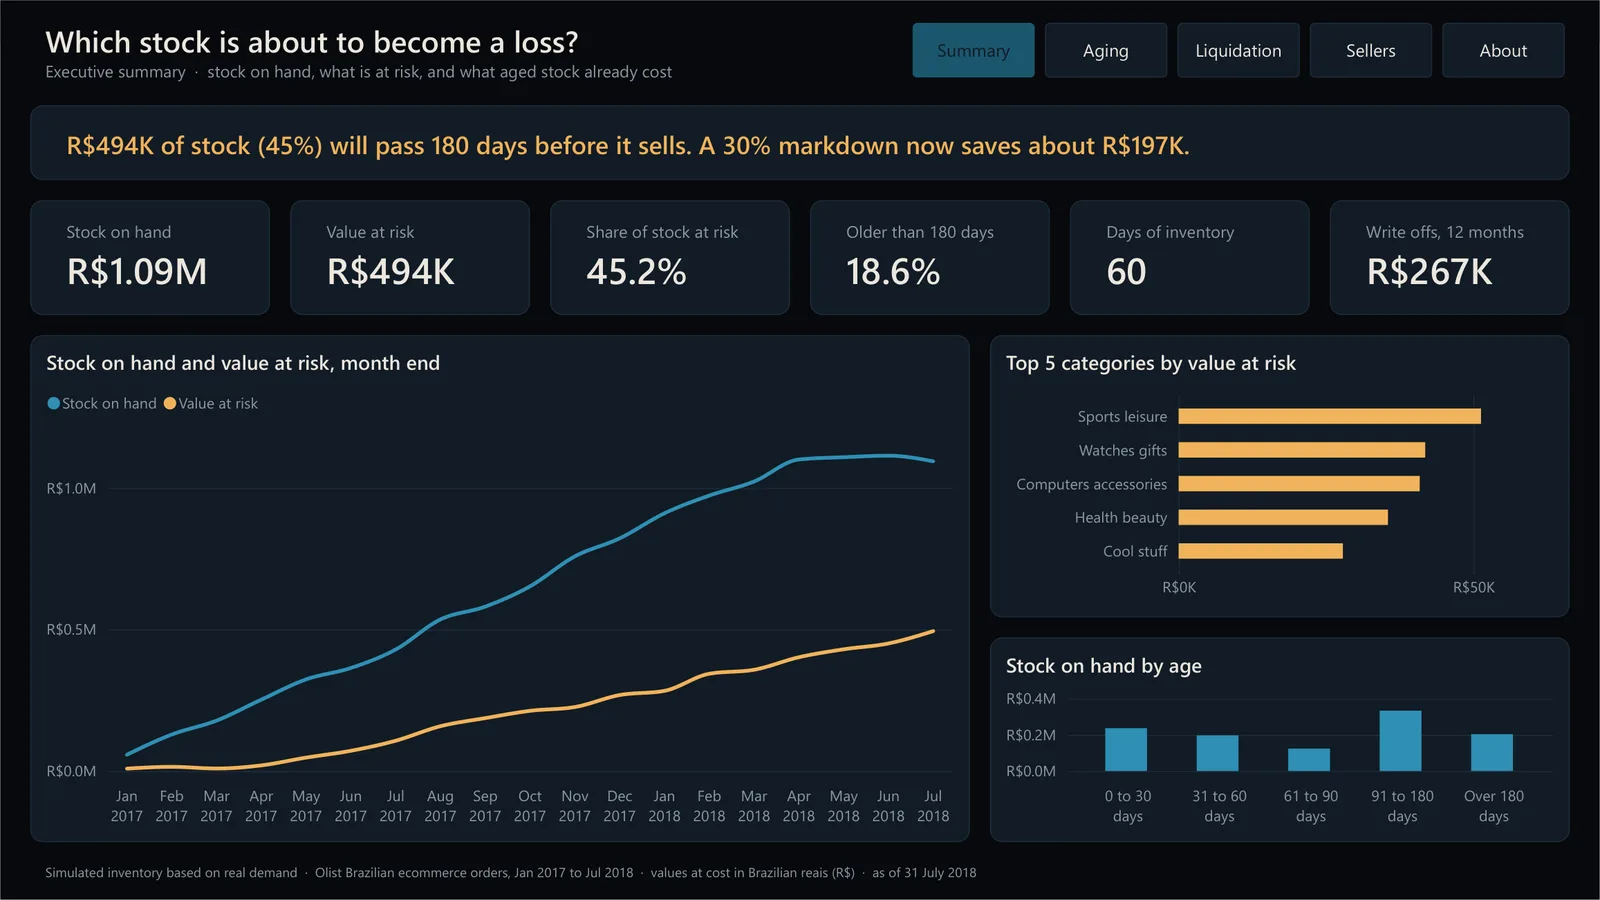
An inventory risk dashboard built on 104,884 real orders from a Brazilian marketplace. It finds the stock that will pass 180 days before it sells, puts a price on that risk, and plans the markdown that saves the most.
- R$494K
- of stock at risk, 45% of the shelf
- R$197K
- saved by a 30% markdown now
- 4,057
- SKUs ranked for action
The .pbix opens in the free Power BI Desktop, with all five pages and the data included.
The problem
Old stock is quiet money.
In retail, the stock that hurts is rarely the stock anyone is looking at. It sits in the long tail, ages month by month, and only shows up when it is written off.
At Daraz I protected $100K of aging inventory by finding it early and acting before it turned into loss. Company data stays private, so this project rebuilds the same thinking on public data, end to end, for anyone to open.
The data
Real demand, simulated stock.
Olist publishes real orders but no inventory, so the stock was rebuilt from the sales. Buyers reorder at a reorder point with a forecast bias, some sellers over order, sales use the oldest batch first, and batches still unsold after 270 days are cleared at a loss. Every step is seeded and documented, so the numbers are reproducible.
Olist orders
104,884 real order lines, January 2017 to July 2018, across 31,981 SKUs.
Python simulation
Purchase batches, first in, first out aging, reorder points and clearance, written to a star schema.
Power BI model
Four fact tables, five dimensions, 52 DAX measures and two what if parameters.
Decisions
Value at risk by SKU, seller and region, and a ranked markdown plan.
Try it
Wait, or mark down?
R$494K of stock will pass 180 days before it sells. Clear it later and most of that is lost. Mark it down now and some of it sells at a fair price.
Move the slider to find the markdown that saves the most. These numbers come from the same formula as the dashboard's DAX.
Assumes each 10 points of markdown clears 15% of the stock at risk within 90 days; the rest is cleared later at the 25% historical recovery rate.
The logic
Value at risk, defined.
Each SKU's last 90 days of sales set its pace. Units sell first in, first out at that pace, and a unit counts as at risk if it would be older than 180 days by the time it sells.
The planner tests every markdown from 0% to 60% for each SKU and keeps the one that recovers the most:
VAR Options =
    ADDCOLUMNS (
        ADDCOLUMNS ( ALL ( Markdown[Markdown] ),
            "@SellThrough", MIN ( 1, Response * Markdown[Markdown] / 0.1 ) ),
        "@Recovered",
            RiskAtList * [@SellThrough] * ( 1 - Markdown[Markdown] )
                + RiskValue * ( 1 - [@SellThrough] ) * Recovery
    )
VAR Best = TOPN ( 1, Options, [@Recovered], DESC )
RETURN MAXX ( Best, Markdown[Markdown] )   // suggested markdown
What it shows
The findings.
- 45%of stock value will pass 180 days before it sells at today's pace. 18.6% already has.
- R$267Kwas already lost to write offs in the last 12 months. Waiting has a price.
- 27%of the risk sits with just 20 of 1,092 sellers: a short call list.
- 40%is the single best markdown. A 30% markdown alone saves R$197K.
Built with
Real demand from the public Olist dataset, simulated inventory. No company data used.